An infographic is an effective content type that presents data and shares information or numbers in an attractive and summarized way for your audience, leading to insight and a better understanding of complex ideas and making information easy to digest. The more attractive the infographic is visually, the more effective it is. Therefore, the demand for infographic development is increasing day by day as statistics show that infographics can increase web traffic by 12%.
Before going through the steps of their creation, we have to mention that infographics have multiple goals and uses. Do you have the curiosity to know some of them practically?
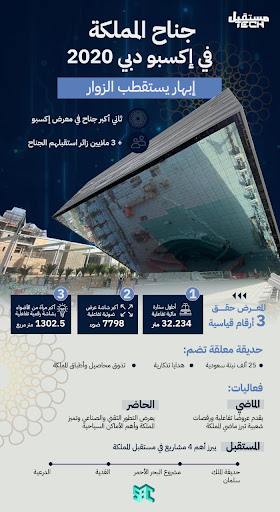
Example for a successful infographic

Why Do We Use Infographics? (Main Uses)
1- Explaining a complex process or procedure
Example: the US central bank raised interest rates.
2- Display data
Example: the UN listing of the poorest countries.
3- Summarizing a long document, article, or report
Example: World Bank report on the economy of the future.
4- Comparison of different data
Example: Spanish and English Champions League winning teams.
5- Raising awareness about an issue
Example: Preventive precautions to avoid infection with the COVID virus.
Who Are The Target Audience?

One of the fundamental objectives of your infographic is to reach your audience and achieve widespread popularity among them. Therefore, selecting the target audience accurately is the first step of creating an infographic, so that you can decide which infographic style is suitable for them and how it can attract their eyes, taking into consideration the extent of the audience’s interest in complex graphics that need more thought, or those in need of further explanation.
Relevance is necessary too, as identifying the knowledge level of the audience sector consuming your content will influence the format and other details of the infographic. So, being aware of the audience’s culture should not be ignored in the process of creating an infographic to help you convey the important message they need to understand without making it difficult or confusing.
How To Set The Goals?

Several questions can form a general and clear guide that helps you set specific goals for your infographic during its creation, such as:
- Why is this infographic being designed?
- What is the main target?
- What information must be highlighted in it?
- When will it be published?
- On which platform will it be published?
If you succeeded in answering these questions easily, congratulations! You have set your goals successfully.
How To Choose Ideas?

First of all, the story of an infographic for a certain topic or a raised issue must be appropriate and of interest to your target audience, so the idea also must be attractive and clear before proceeding on with the implementation or wasting effort and time on it.
Answering those several questions can help in evaluating the idea:
- Will this idea attract the target audience?
- Will the target audience interact with it?
- Is an infographic a suitable format to present this idea?
- Does the idea need more explanation and clarification?
- Is the new information I’ll add regarding this idea?
If you answered the previous question with “yes”, it means that you chose a good idea, and it’s time to move to the next step, “research”.
Be An Investigator!

After settling on a clear-catching idea, deep, powerful, and accurate research is essential, and it must be based on reliable and different sources such as articles, studies, books, and references to help synthesize ideas and information that will be included in the infographic, as well as an initial perception of what structure to choose for the infographic.
In addition, it is advised to check other infographic designs covering the same idea to make sure that the infographic will offer informational, special data from a unique point of view.
How To Develop Initial Structure For An Infographic?

There are many infographic formats, and choosing the best format for your idea depends on several factors, including its purpose, the platform it will be published on, whether through a digital platform or a printed advertisement, for example, in addition to the size and type of the information it contains.
It is possible to start by drawing a draft on paper, outlining and organizing each part of the infographic and the elements, whether images or symbols, till finally reaching the desired form.
What Are The Infographic Types?

Here we have reached the final step, choosing the infographic’s form. The following formats are known as the main types of infographics:
- Timeline infographics (highlighting important dates).
- Process infographics (providing a summary or overview of the steps in a process or using a product).
- Geographic infographics (related to geographic areas and regional data).
- Informative infographics (they provide an overview of a topic, an attractive article, an idea or a new concept).
- Lists infographics (collection of tips, summarize a presentation, or support an idea by presenting its main points).
- Statistical infographics (viewing statistics or comparing different items).
According to the idea you chose, you can decide which format fits it, and then you can work on the visual identity of the infographic, choosing the suitable colors and fonts for your topic and format, and don’t forget to make sure that your content is well distributed in the design to make the infographic comfortable to your eye.
Finally, we have to mention that you don’t need a professional designer to finalize your infographic as there are many websites that can help with that, such as Canva, Venngage, and Piktochart.
To sum up, carefully addressing the steps of designing an infographic, and giving each its proper timing, will help achieve the best work in relation to content and form, and therefore wide spread, desired goals and reach the target audience, so invest in your infographics well!

