
Media agencies and content creators are increasingly using Snapchat channels due to the great opportunities it offers to reach the audience, and the chance to make good profits if the content appeals to the growing Snapchat audience, and thus increase the digital revenue of a media entity.
Snapchat’s revenue is directly correlated with views and content reach. For example, if you have a 10-minute story with a view rate of more than 40% (4 minutes), this will instantly reflect on the reach of the story to the Snapchat audience who is interested in this type of content.
In order for any media entity to achieve its goals on Snapchat, it must understand how to read Snapchat analytics or insights of published stories to constantly improve its performance, which will help promote content and its spreading, achieving by that an organic views increase, and the number of people who view the channel or story through the main discover option.
Through the Snapchat insights management tool, we provide you with a guide that would support measuring the channel’s metrics, in aim of increasing the number of followers and the spread of that channel.
Main Channels Performance Factors
For a start, here are main factors to determine how your channel on Snapchat is performing:
- Check your coverall performance throughout a certain time frame; for example you can compare the performance on daily, weekly and monthly basis in comparison to same time frame.
- The number of viewers of your stories ; compare how many are actually subscribed to your channel
- The average time viewed and the percentage of view time. The higher your view time, the higher reach your story will get on Snapchat
- The number of new subscribers to your channel, which shall be your ultimate goad to covert viewers to
Your Guide to viewing the Channel Analytics step by Step
First: Analysing the results of the channel as a whole
- After logging into your account, tap the insights tab to access ‘analytics’
Select a Time Range to view stories performance.
Options range from a day to a year, a user can customize and select the date to view their metrics for.
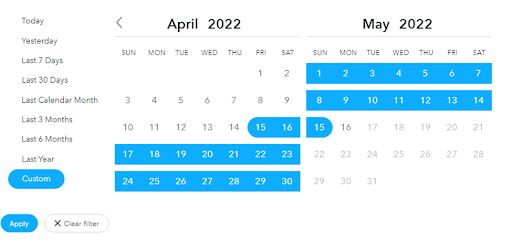
After clicking on “Apply”, the graphs of your channel’s results will appear in the specified time period, according to 3 metrics.
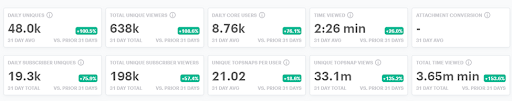
1 – Audience
Numerous metrics and analytics appear, in addition to the extent of progress or relapse in percentage during the previous period, a percentage in green with a (+) sign next to it indicates progress, while red color with a (-) sign appears in case of relapse in comparison to the previous time frame selected.
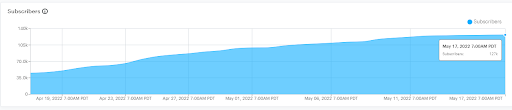
Daily Unique Chart
Provides the number of Snapchat users interacting with your channel every 24 hours, while specifying them into followers and unfollowers while tracking them daily.
The chart here clearly shows the ups and downs of the channel’s performance according to the number of viewers of the story posted on the day, which demonstrates successful stories with the highest views ,to focus on similar content that attracts Snapchatters.
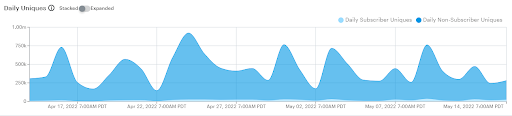
This metric also applies to Subscribers, offering an indication of the number of those who joined your channel on a specified period.
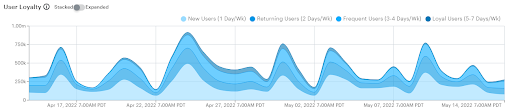
User Loyalty
This metric measures the loyalty of your audience over a period of a week, how often have they watched it, and on average it focuses on the last 5 to 7 days.
It is considered an important indicator of how well users are engaged with the provided content, causing them to come back to check it more frequently.
You can find out the percentage of subscribers versus non-subscribers by clicking at the desired option from the tabs on top of the chart.
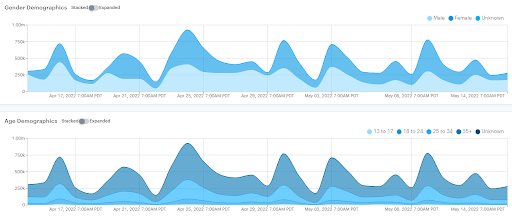
Analytics also offer the percentage of males and females, and the age range of your viewers.
2 – Behaviour
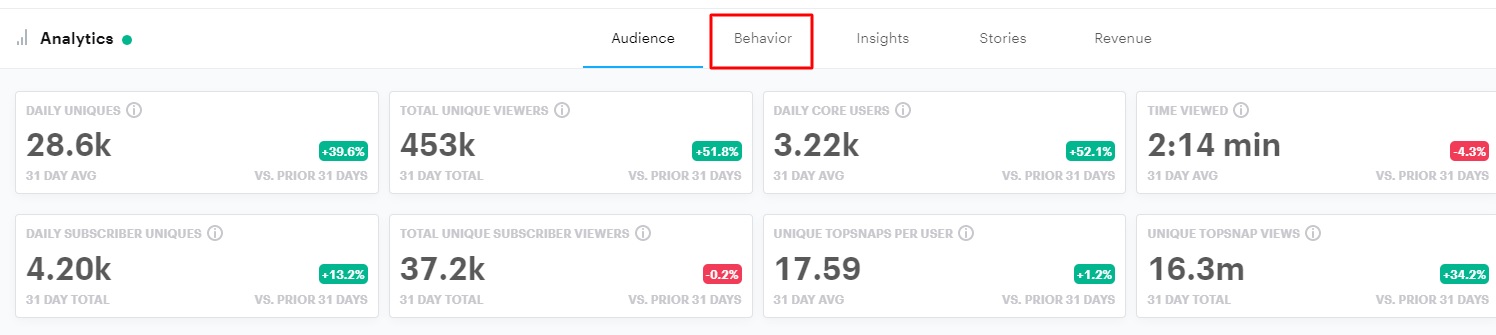
We observe another important set of analytics:
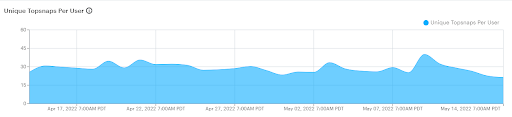
Unique Topsnaps Per User
The average number of snaps viewed by users per day.
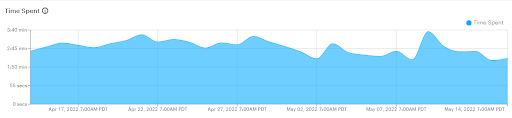
Time Spent
The average daily watch time a Snapchat user spends on your channel, and the most watched are days related to the best of stories.
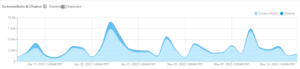
Screenshots & Shares
The total number of screenshots and shared snaps in a day.
3 – Insights
Targets extremely important results:
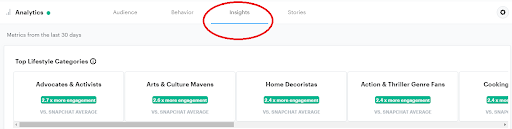
Top Lifestyle Categories
Provides relevant audience segments based on what Snapchatters watch, and what they care about. Classifications for your followers are made according to the most popular lifestyle categories on Snapchat, such as art, cooking lovers, adventure seekers, and other many categories, enabling you to address the interests of your audience and viewers in the channel to achieve the best results.
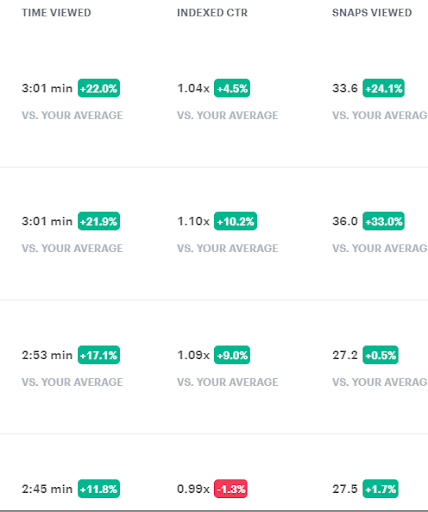
Top Performing Tiles
Provides the best tiles results based on factors including (time viewed- click through rate – snaps viewed) by clicking on it. The tiles can be arranged according to any of the previous 3 criteria when pressed.
This classification helps to identify the best performing tiles, and to analyse the common factors between them, whether in terms of images or headlines, in order to learn what works best when planning future stories.
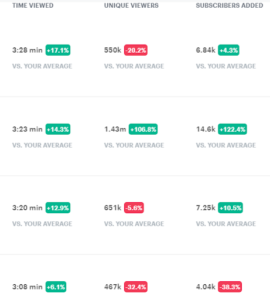
Top Performing Stories
The best performing stories over a selected period of time (a month- for instance)
According to criteria such as (average watch time – number of viewers – number of new subscribers)
Similar to the previous criteria of tiles, performance can be improved by tracking the best and the least stories.
In the next article, we will go over how to read and analyse the result of each story on its own.