
In a previous topic, we went over how to understand the results of your Snapchat channel and analyze its performance during a certain amount of time, to show you how strong your Snapchat performance is in general. In this topic, we are going to discuss how to track the results of each story separately, which is as important as tracking the results of the channel.
Understanding story performance explains why a particular story got good views, reach, and results. This way, you can tweak and optimize your strategy and features on Snapchat for better results and similar reach for future stories.
The benefits of tracking the results of stories regularly are summed up in the following points:
- Understand the stories with good performance when it comes to avg.watch time, unique users and story engagement.
- Evaluate the Snaps that got the highest shares, screenshots and subscribers.
- Identify the tiles (stories cover) that gave the best results, and apply their standards in making similar covers.
- Know how to understand why people left your story too early, or why a certain story is performing better than others.
Important to know: Ads on snapchat appear after the third or fourth snap in your story. If your viewer did not reach that, most probably no ads will appear and you won’t be able to monetize this viewer.
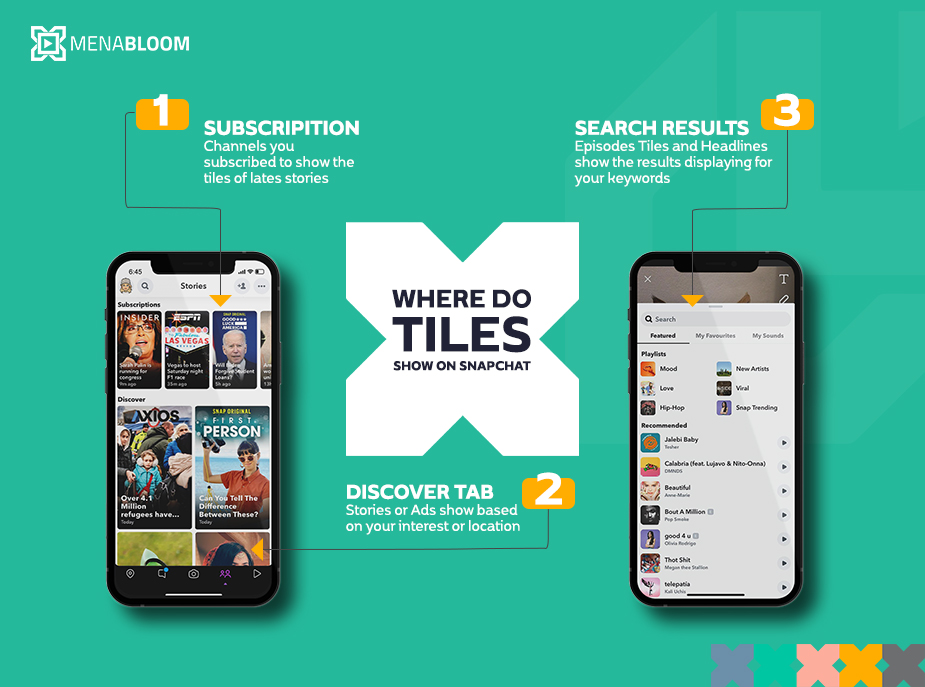
Tiles (Stories Cover Photos) & Headlines performance:
Snapchat allows choosing 4 different unique tiles and headlines for every story. They allow you to test with their audience and if a certain tile is performing better than the other 3 , this is the one that will get the highest distribution.
1 – Tiles is the single most important factor in determining the performance of your story. They are what your viewer sees before deciding to watch your story.
A set of options and numbers show details of the story’s performance, results and the engagement rate of tiles.
By moving to Tiles, we can identify the viewership and evaluate the best and worst according to the criteria (click-through rate – time viewed – snaps viewed).
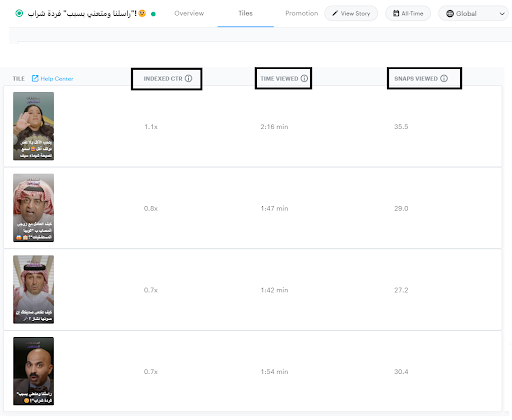
Tiles Performance Matrices:
CTR
Refers to the click through rate that divides the impressions versus how many people clicked(tabbed) on a certain tile. This gives an overall the tile that has the highest click through rate had the highest performance.
Time Viewed
The time viewed refers to the average watch time that a certain tile has been able to achieve through the viewers that clicked this tile. In the above example the highest viewing tile was 2:16 minutes, which shows the popularity of the tile chosen for the story and the headline given with it.
Number of snaps
The number of snaps an actual tile did achieve is another indication that goes inline with the CTR and watch time.
2 – Story General Performance:
Now after we identified what tiles performed better, we take a look at the story overview statistics.
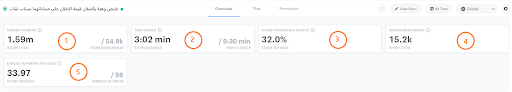
1 – Unique viewers
The total number of individuals who viewed the first snap of your story for at least one second. The view is only counted once, regardless of how many times it is actually watched (in the previous example it was 1.59 million viewers)
Those are Snapchat audiences who have actually clicked on one of the tiles stories that they saw on their discover page.
Snapchat recognizes stories that have the highest watch time and engagement by distributing the story to more audiences. So this story got the chance to attract 1.58 million viewers of snapchat within the given days of publishing.
2 – TIME VIEWED
Shows the average time a story is viewed from the audience that clicked on the story. It is one of the most important of metrics, as it will allow you to determine whether your Snapchat Story resonates with your audience and attracts them or not, in addition to times in which you have succeeded in engaging them enough to watch your entire Snapchat Story.
In this example the average was 3 minutes from the original time of the story 9 minutes.
3 – STORY PERCENTAGE VIEWED
The average watch time of the story. If a story received more than 25% Average watch time that is recognized as good performance.
The example above recognized an average of 32%>.
4 – SUBSCRIBERS ADDED
It is what every marketer aims for, the long term investment in your viewers has to be to convert them to subscribers. Subscribers see your latest stories in their feed .
The story above was able to attract 15k+ subscribers out of the 1.58 million unique users, which remains a great performance indicator for the story.
5 – UNIQUE TOP SNAPS PER USER
This metric tracks the average number of snaps which Snapchatters viewed in a Story out of the total snaps that you are story is divided to.
A higher number gives a positive indication that users are viewing more of your story snaps and also reflect in sharing more revenue of the ads showing in a certain story.
Important to know: Ads on snapchat appear after the third or fourth snap in your story. If your viewer did not reach that, most probably no ads will appear and you won’t be able to monetize this viewer.
In the above particular example, an average of 33 snaps viewed means there are more than 8 ads that have been shown for users while watching the story.
Now after we viewed the general matrices, let us dig into more details that are available on scrolling through your page of analytics.
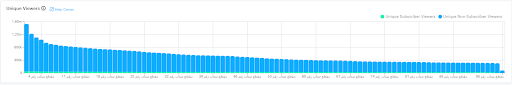
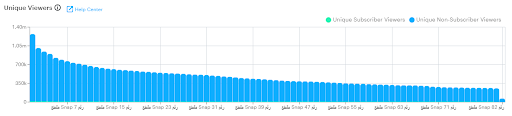
Unique Viewers
Shows viewers per specific snap in your story.
The analytic shows the viewership extent, and its gradual decrease from the first snap to the last, while clarifying the total number of viewers including the number of followers, and non-followers for every single snap.
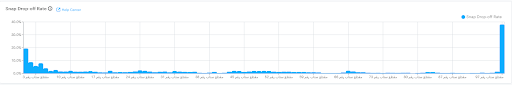
Snap Drop-off Rate
You succeeded to get an appealing tile with an attractive headline, then you did get a high watch time average.
Here you can understand what happened after Snapchat users clicked your first story.
This Matrix specifies the percentage of users who continued watching over a given snapchat story.
It might also refer to some parts of your story that viewers don’t like, this information could be used to better optimize the structure of your Stories for better engagement in next stories, by focusing on the low exit rating snaps.
Example of a poor performing story
Example of a great performance story
This is one of the most important elements that affects all the other tracking and statistics in the story. Your goal is to have a good introduction appealing enough for more people to stay watching.
The more snaps they watch, the higher your watch time, the higher the revenue share you achieve through this specific story.
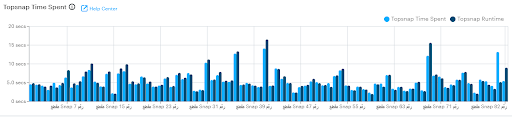
Topsnap Time Spent
It shows the time that users spend watching each snap versus the completion rate for each one.
The snaps with a 100% viewing completion are the best, as users have not skipped and fully completed watching them.
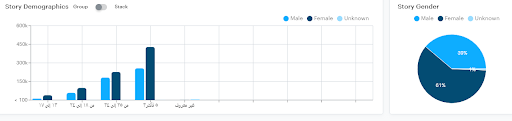
Story Demographics
Helps know your audience, by offering a classification of story viewers in terms of age and gender. This information is essential as it indicates whether your content reaches the target users or not. For example, if you provide fashion and beauty content that does not achieve good views among women, you need to create more targeted campaigns.
Screenshots & Shares
Screenshots are an indicator of how your content is resonating with your audience through the number of times the screenshot was taken or the snap was shared, it also shows the most successful and well reached snaps.
As a summery, and from our experience, here are the top tips that will help you improve your stories performance:
- Choose attractive and unique tiles with distinctive images to seize the attention of the audience. Helpful ideas would be to include celebrities, a delicious meal or an exciting adventure, in addition to eye-catching headlines.
- Story Snap Introduction: Choosing an interesting first snap as the beginning for the story as it is the strongest part, to attract the viewer to continue watching the story.
- Story Editing : Avoiding prolongation and extra details that might not be important and cause the viewers to leave the story. The Snapchat audience needs to get information fast and keep them intrigued to keep watching.
- Use Story Optimization tools : Snapchat offers you more tools to increase stories engagement:
- Stories subtitles: As most of your audience see your content on mute, the text on your video helps them to decide to keep watching.
- Add multiple tile covers within your story. This is a tool that is particularly helpful when you have a story of different segments. So if the user drops off from one segment the tile of the next segment will show on their feed and attract them to keep on watching.
- Use an attract subscribe snap outro. This will help increase the convergence of your story.
- Use visuals or snap quotes that are shareable, for example (written tips, quotes, recipes..etc).
And finally, good results come from consistent optimization of your stories. This is what MENABloom learned from managing and creating Snapchat channels for our media publishing partners.